


Transforming 4M1E, 5M, 6M & Ishikawa into Powerful Quantitative Tools
Table of contents:
Introduction
Types of Fishbone Diagrams
Fishbone diagrams from Minitab, Chegg.com, Six Sigma, Tarun Kanti Bosean & Dane Boers.
The 4M1E, 5M and 6M Models
Three models for you to enhance management.
Problems with an Arbitrary Approach to the M Models
Brainstorming teams identifying causal factors can make up for the limitations in these models.
Man (People) and Materials As The Dominant Factors
Man and material factors are more impactful than methods, machines, and management, especially in competitive industries like automotive and electronics manufacturing.
Introduction
Kaizen is the Japanese term for change for the better, or for improvement. It was developed in Japan after World War II based on the work of Walter Shewhart and W. Edwards Deming, which Toyota applied to its Lean philosophy of continuous improvement.[1]Fundamental to root cause analysis (RCA) and process improvement is to examine the various causes that impact an effect. The effect may be a process that is inefficient, inconsistent, or even dangerous. It may also be an effect that generates unacceptably high error rates. One of the most trusted tools to determine cause and effect is known by a variety of names such as Ishikawa or fishbone diagrams, 4MIE, 5M, and 6M. They all share the same approach to RCA, to identify all types of causes to the problem or the effect.
The fishbone is to most visual way to capture the cause-and-effect process with individual fish spines or ribs for each causal category. Fishbone diagrams help understand the reasons for an effect or problem by structuring their causes in smaller categories. It can also be used to examine how contributing factors are related to each other.
The popularity of these types of tools dates back over 50 years and comes from their ease of use and visual nature. It is simple to see the problem or effect and the major factors influencing the effect, the major bones attached to the spine, and the potential causes as minor bones.
It is important to note that one of the M’s in 4M1E, 5M, and 6M stands for Man. It is unfortunate that this M has not been replaced with People. These tools were created at a time of sexism and systematic discrimination against women. Even the current literature describing 4M1E, 5M and 6M fails to address the badly outdated nature of these acronyms. This is particularly troublesome when women are seriously underrepresented in the ranks of manufacturing management.
Types of Fishbone Diagrams
In its simplest form, a fishbone diagram has no predetermined affinities or categories allowing the user to create as many as needed to conduct the analysis.
Exhibit 1 is from Minitab showing a basic diagram in which the user assigns categories or affinities.[1]
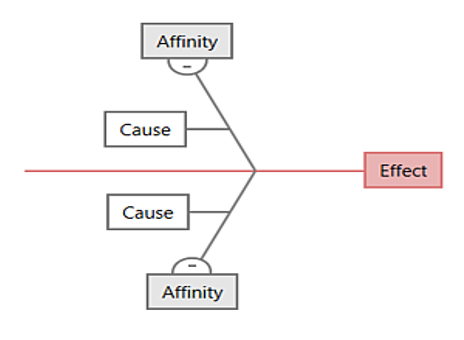
Exhibit 2 is from Chegg.com showing an example of a simple fishbone exercise to find the causes for a car not starting.[2]
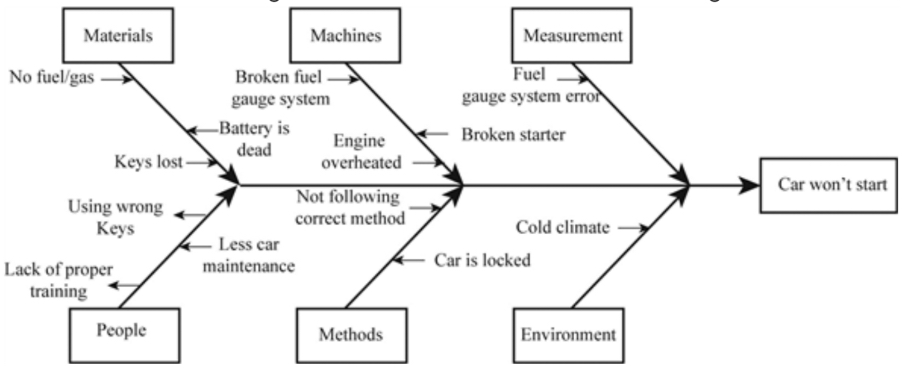
Exhibit 3 is from Six Sigma Definition showing the basic structure of a fishbone typically used in manufacturing with the problem or effect as the head of the fish, the causes as its ribs.[3]
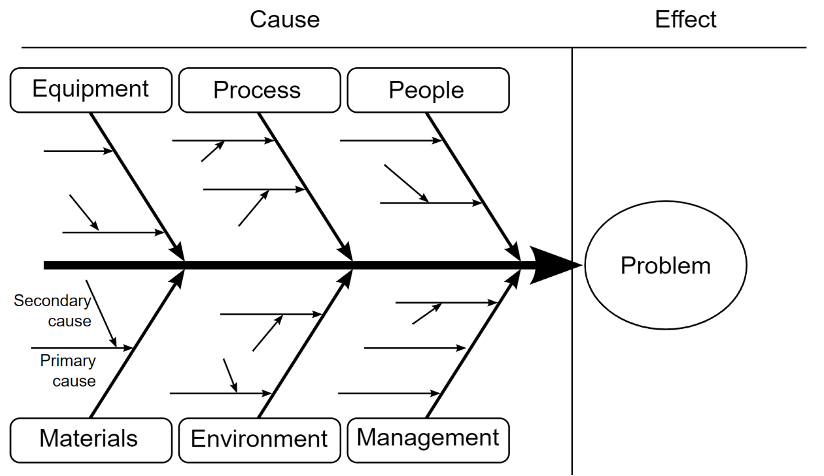
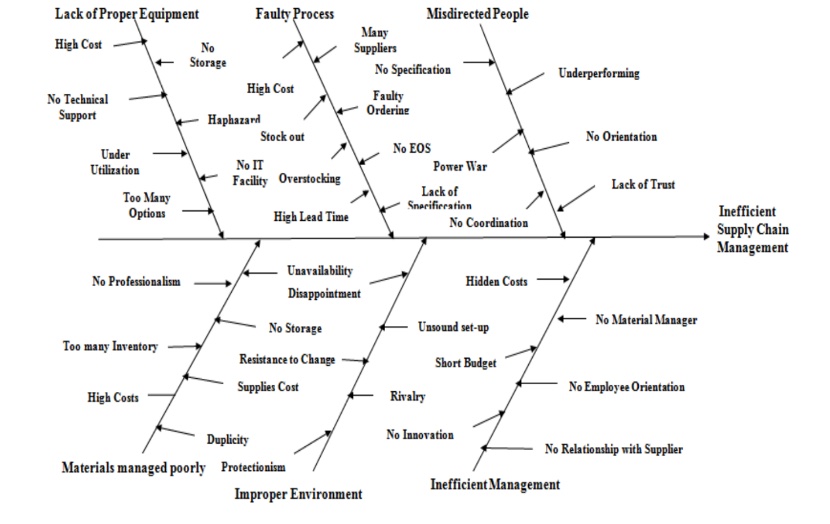
Exhibit 4 is from Tarun Kanti Bosean writing in the International Journal of Managing Value and Supply Chains show an example of a complex fishbone exercise to find the causes for inefficient supply chain management.
Regardless of the complexity or type of fishbone cause-and-effect analysis, the process is pretty much the same:
Step One. Identify the process effect to be analyzed as part of the continuous improvement effort. This becomes the symbol on the right of the diagram, the head of the fish.
Step Two. Next add the ribs to the fish containing the causes of the effect. The ribs should be divided into categories. The classical categories include materials, people, equipment, method, measurement, and environment. These categories are only suggestions and will change depending on the causes you are investigating.
Step Three. Identify all the causes that the team suggests. All causes should be treated equally at this stage with no criticism from team members. Add subbranches if needed to drill down to more detail.
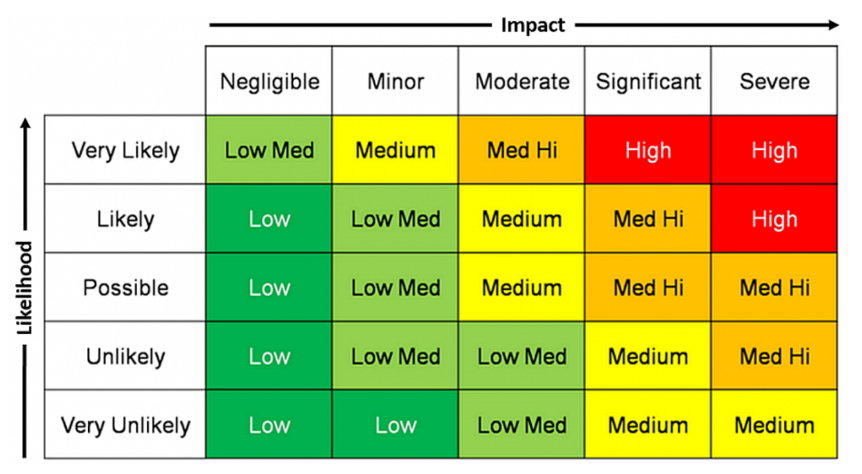
Step Four. This is an optional step. Score each cause using a risk matrix that multiplies the severity of the cause by the likelihood of the cause. Using a scale of one (1) to five (5), with five being the greatest problem, each cause now has a score. The maximum score is 25. The highest scoring items should be tackled first and deserve the greatest effort. The risk matrix is a popular tool to prioritize process improvement and risk reduction efforts. The risk matrix is easy to use and works well for team brainstorming sessions. It is not a quantitative tool, so it is subject to subjectivity among its participants.
Exhibit 5 is from Dane Boers writing for ARMS Reliability showing the matrix as a heat map, with green as the least risk and red as the greatest risk.[4]
The 4M1E, 5M and 6M Models
4M1E stands for Man, Machine, Method, Material and Environment. 4M1E is a model for conducting root cause analysis, quality improvement and leaning out a process. Although widely used in manufacturing, it has been successfully applied in in non-manufacturing areas such as finance and customer service.
There are large number of potential categories for the 4M1E. Here are a few.
Man (People)
- Skill
- Technology
- Organization
- Resources
- Communications
Machine
- Design
- Installation
- Supplier
Methods
- Schedule
- Procedure
Material
- Design
- Quality
Environment
- Room Temperature & Humidity
- Lighting Conditions
- Social Environment· Pace of Workflow
The 5M model is similar to 4M1E Model and based on T.P. Wright’s work at Cornell University that describes a machine-man-environment triad depicted as three interlocking circles and one all-encompassing circle.[5] The smaller circles are labeled Machine, Man and Medium with a space in the middle where they intersect representing the Mission. A larger circle is labeled Management.
Exhibit 6 is from Wikipedia showing three interlocking circles and one all-encompassing circle.[6]
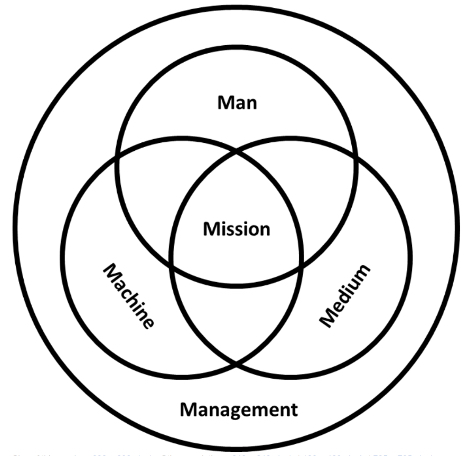
Wright classified The M’s as follows:
· Man (people): including the physiology and psychology of those involved, as well as their performance and proficiency.
· Machine (equipment): including the design, manufacture, maintenance, reliability, performance, etc.
· Medium / measurement (environment, inspection): including weather, terrain, obstructions, lighting, etc.
· Mission (purpose): the reason these three factors are brought together.
· Management (leadership): the prevailing supervisory approach in terms of regulations, policies, procedures, and attitude involved in establishing, operating, maintaining, and decommissioning.
These have been expanded in some programs and projects to include an additional three, and are referred to as the 8Ms:
· Material (includes raw material, consumables, and information)
· Method / mother nature (process, environment)
· Maintenance[7]
The 6M Model stands for Manpower (People), Method, Machine, Material, Milieu and Measurement. 6M is a mnemonic helping to remember the six characteristic dimensions to consider when conducting cause-and-effect brainstorming sessions.
Problems with an Arbitrary Approach to the M Models
As mentioned earlier, 4M1E, 5M, and 6M are mnemonics, a pattern of letters that assists in remembering something, in this case the major bones of a Fishbone diagram. The problem with this methodology is that complex operations usually present a wide variety of causal factors that don’t lend themselves to arbitrary causal categories. My experience running such projects is to let the brainstorming team create the causal factors that make sense to them in solving a problem or improving a process. The first drafts of such fishbones can look very busy, but the number of items can be substantially reduced by applying the impact/likelihood scoring system described earlier. The next step would be to apply a Five Whys root-cause-analysis for the highest scoring items. I found teams usually enjoy conducting these types of qualitative analysis and were surprised in how effective simple brainstorming tools can be.
Man (People) and Materials As The Dominant Factors
Mao Yihua and Xu Tuo’s researched the impact of 4MIE and by extension 5M and 6M on engineering quality finding that Man, Materials, and Environment factors dominated quality. This follows the long held believe that man and materials factors were more impactful than methods, machines, management, etc. They noted the complexity and dynamic nature of environmental factors and the difficulty in controlling them. For example, minor changes of environment can seriously affect quality.[8]
Mao and Xu explain why equipment plays a smaller role. Equipment has been typically carefully designed, tested, and maintained to complete repetitive tasks. If there is something wrong with the equipment, trained equipment operators will quickly address the issue.[9] Mao and Xu also explain why management methods, supervision methods, engineering methods are not major factors in quality and efficiency. In most environments, these are mature processes with deep expertise.[10]
Their findings make sense, especially in automotive manufacturing and in electronic manufacturing such as surface mount technology (SMT) in which global competition has compelled decades of Lean, Six Sigma and related process improvement efforts. It is unlikely that a manufacturer with poor methods of operations could have survived in such a fierce global marketplace.
Continue reading the Limitations of These Models & How to Overcome them in Part 2
Read More
Supercharging Kaizen & Six Sigma With Computer Vision (Smart Shop Floor Part 3)
Time and Motion Study (Smart Shop Floor Part 2)
What is Industry 4.0? (Smart Shop Floor Part 1)
Anthony Tarantino, PhD
Six Sigma Master Black Belt, CPM (ISM), CPIM (APICS)
Adjunct Faculty Member, Santa Clara University
Author of Wiley’s Smart Manufacturing, The Lean Six Sigma Way. www.wiley.com (May 2022)
Senior Advisor to PowerArena