


Transforming 4M1E, 5M, 6M & Ishikawa into Powerful Quantitative Tools
Table of contents:
Limitations of 4M1E, 5M, 6M & Fishbone Cause and Effect Analysis
Limitations lie in their qualitative nature, reliance on participant expertise, tendency to address too many potential causes without prioritization and more.
Overcoming the Limitations of Cause-And-Effect Analysis with Computer Vision
Computer vision offers a quantitative approach to analyzing interactions among people, machines, and materials, constantly monitoring from multiple perspectives.
Limitations of 4M1E, 5M, 6M & Fishbone Cause and Effect Analysis
Cause and effect analysis is classified as a qualitative brainstorming tool to conduct basic root cause analysis. It is typically used in conjunction with another popular qualitative brainstorming tool, Five Whys. Neither tool is considered quantitative because of the subjective nature of the analysis and lack of hard data sets. The effectiveness of the process is dependent on the expertise of the participants. But even with the most experienced participants, the analysis lacks compelling data around the various causes and the methodology itself has its limitations.
A major problem in this type of cause-and-effect analysis is the tendency to attempt to fix everything that may be causing a problem. It is rare that to find an operational issue with only one causal factor. Drawing a fishbone-type diagram with all the causal factors can look messy and not help to prioritize the key issues that should be pursued. Another problem is the lack of an agreed upon and documented methodology in how to build the fishbone.[11] In the training I have received, and the classes I have taught it is typical to only show examples of fishbones and leave it up to the users to decide how to deploy it or how to define root cause.
Overcoming the Limitations of Cause-And-Effect Analysis with Computer Vision
Unlike the subjective nature of traditional cause-and-effect qualitative analysis, computer vision can provide quantitative data around people, machines, and materials. It does this by watching all the physical action on a 24×7 basis and potentially from multiple vantage points. Not only is computer vision watching each category, it is watching the interactions between each category, i.e., how people interact with the equipment they are operating on, and how people interact with the materials they are handling.
Computer or machine vision is able to do all this using artificial intelligence, machine learning, and deep learning. As Steven Herman writes in Anthony Tarantino’s Smart Manufacturing, The Lean Six Sigma Way, “It is important to clarify the difference. Artificial intelligence refers to software performing tasks traditionally requiring human intelligence to complete. Machine learning is a subset of artificial intelligence wherein software “learns” or improves through data and/or experience. Deep learning is a subset of machine learning, usually distinguished by two characteristics: (1) presence of three or more layers, and (2) automatic derivation of features.”[12]
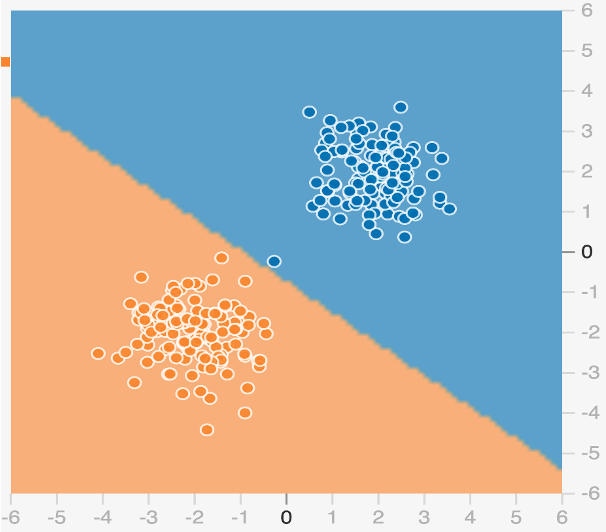
Herman notes that machine learning is often discussed as if it is black magic, but the underlying concepts are relatively simple mathematics. “At its core, the algorithm checks whether a point is above or below a line; points above the line are blue while points below the line are orange. The line itself is learned from training data by optimizing the number of points correctly classified by the algorithm. Most machine learning operates on a similar principle with a massively scaled up number of dimensions.”[13]
Exhibit 7 shows how a simple machine learning algorithm learns to differentiate between two clusters of points.
Herman asks the reader to imagine that inputs are sensor data from a machine and the outputs are whether the machine would fail within the next day, month, or year. “The algorithm then learns to pick out changes and relationships in the data which might not be obvious. This is not hypothetical because many companies are already using machine learning to drive predictive maintenance, reducing unnecessary downtime and avoiding catastrophic failures. Problems, such as predictive maintenance, rarely arise in academia. Instead they are driven by the needs of businesses and processes. This opens vast opportunities for advances in machine learning by applying it to the problems encountered in manufacturing.”[14]
Besides sensors, computer vision offers major opportunities to collect additional data about systems and processes. Cameras are able to detect operators, machine state, defects, barcodes, and other vital information, providing greater insight into the manufacturing process. This data can drive process optimization and improvement. Today’s computer vision is intertwined with machine learning because most state-of-the-art computer vision is built with machine learning models. In many cases, it is much easier, cheaper, and more accurate for a computer to monitor these processes rather than a human.[15]
While computer vision has many industrial applications, there are nine applications that assembly and distribution facilities have found the most valuable:
- Counting, sorting or measuring parts or components
- Checking for missing parts and incomplete shipments
- Performing calibrations and other product testing
- Verifying positioning of individual parts
- Recognizing and checking for proper shapes, colors and sizes of items
- Performing 3D imaging for digital twinning, compliance, documentation or other functions
- Reading and verifying printed identifiers or barcodes
- Providing data for traceability, process improvements and tracking defects to their source
- Delivering Pass/Fail product inspection and kicking out rejected parts and shipments[16]
The following SMT use case demonstrates how smart camera systems can provide valuable new insights into cause-and-effect analysis by replacing subjective and qualitative assumptions with concrete data sets and not just for small sample sizes but for all items going through the manufacturing process.
Read More
4M1E & Computer Vision-1 (Smart Shop Floor Part 4)
Supercharging Kaizen & Six Sigma With Computer Vision (Smart Shop Floor Part 3)
Time and Motion Study (Smart Shop Floor Part 2)
What is Industry 4.0? (Smart Shop Floor Part 1)
Anthony Tarantino, PhD
Six Sigma Master Black Belt, CPM (ISM), CPIM (APICS)
Adjunct Faculty Member, Santa Clara University
Author of Wiley’s Smart Manufacturing, The Lean Six Sigma Way. www.wiley.com (May 2022)
Senior Advisor to PowerArena
Notes
[1] Anderson, S. (2020) Discovering Four Types of Fishbone Diagrams. Minitab https://blog.minitab.com/en/four-types-of-fishbone-diagrams#:~:text=The%204S%20Fishbone,used%20in%20nearly%20any%20industry. (Accessed 1 May 2022)
[2] Chegg.com. https://www.chegg.com/homework-help/quality-6th-edition-chapter-4-problem-40p-solution-9780134413273 (accessed 13 August 2021).
[3] Lean Six Sigma Definition, https://www.leansixsigmadefinition.com/glossary/fishbone-diagram/ (accessed 3 June 2021).
[4] Boers, D. Beyond the Risk Matrix. ARMS Reliability. https://www.thereliabilityblog.com/2017/09/13/beyond-the-risk-matrix/ (accessed 18 June 2021).
[5] Stolzer, A.J.; Goglia, J.J. (2016). Safety management systems in aviation. Ashgate Publishing. https://www.amazon.com/Safety-Management-Systems-Aviation-Stolzer-dp-1472431758/dp/1472431758/ref=mt_other?_encoding=UTF8&me=&qid=
[6] Wikipedia. 5M Model. https://en.wikipedia.org/wiki/5M_model (Accessed 2 May 2022)
[7] Bradley, Edgar (2016). Reliability engineering : a life cycle approach. Taylor and Francis. https://www.amazon.com/Reliability-Engineering-Approach-Business-Management/dp/149876536X?asin=149876536X&revisionId=&format=4&depth=1
[8] Mao Yihua, Xu Tuo (2011). Research of 4M1E’s effect on engineering quality based on structural equation model. Systems Engineering Procedia 1 (2011) 213–220 file:///C:/Users/t/Desktop/Research_of_4M1Es_effect_on_engineering_quality_b.pdf (Accessed 1 May 2022)
[9] Mao, Xu
[10] Mao, Xu
[11] Paradies, Mark (2020). Fishbone Diagram Root Cause Analysis – Pros & Cons. TapRoot. https://www.taproot.com/fishbone-diagram-root-cause-analysis-pros-cons/
[12] Herman, Steven, AI, Machine Learning, and Computer Vision, in Anthony Tarantino, Smart Manufacturing, The Lean Six Sigma Way (May 2022). John Wiley and Sons.
[13] Herman, Steven
[14] Herman, Steven
[15] Herman, Steven
[16] Nichols, Megan(2020). 5 Ways Machine Vision Improves Your Manufacturing Quality. Design Spark
https://www.rs-online.com/designspark/5-ways-machine-vision-improves-your-manufacturing-quality
[17] Phillips, Mike (2016). Automated vision system checks surface mount components. Vision Systems Design https://www.vision-systems.com/cameras-accessories/article/16736845/automated-vision-system-checks-surface-mount-components (Accessed 5 May 2022).
[18] Nichols, Megan
[19] Nichols, Megan
[20] Phillips, Mike