
5 Production Line KPIs Every Factory Manager Should Be Tracking
— And Why Most Aren’t Getting Useful Data From Any of Them
Most manufacturing organizations track KPIs. Fewer of them are actually managing with them.
The gap between “having a dashboard” and “making better decisions from it” comes down to data quality, data timeliness, and, critically, whether the data you’re collecting reflects what’s actually happening on the floor, or just what your systems are configured to record.
A cycle time figure derived from manual stopwatch studies conducted twice a quarter is technically a KPI. It’s also nearly useless for driving continuous improvement. A defect rate that only counts units flagged at final inspection misses every rework event that happened silently upstream. An OEE score calculated from machine logs alone tells you nothing about the human-side bottlenecks that may be accounting for the majority of your throughput loss.
The problem isn’t a lack of KPIs. It’s a lack of the right data infrastructure to make those KPIs reliable, continuous, and actually connected to what’s happening on the production floor.
This article covers five KPIs that matter most for production line efficiency — and how modern factory management platforms are changing what it’s possible to know, and how quickly.
Download Case Study: EMS manufacturer achieved 5.2% UPH improvement
Why Data Quality Is the Real KPI Problem
Before getting into specific metrics, it’s worth naming the structural issue that undermines most factory KPI programs.
Traditional data collection on the production floor is slow, sparse, and human-dependent. Industrial engineers conduct time studies manually. Supervisors fill in shift reports. Quality teams log defect counts at inspection stations. The data that reaches management is a summary of summaries, already hours old by the time it’s reviewed, and representing a fraction of the actual production activity it’s meant to describe.
One time study for a single product requires an industrial engineer to spend 24–48 hours on the floor. That effort yields approximately 15 minutes of usable data per month. Source: PowerArena — AI Vision in 7 Factory Scenarios
At that data density, you’re not managing production. You’re managing impressions of production.
Modern factory management platforms, built on AI vision and IoT integration, replace this with continuous, automated data collection. The result isn’t just faster reporting. It’s fundamentally different information: dense, granular, and genuinely representative of what’s happening at each station, each shift, in real time.
The 5 KPIs That Matter Most
KPI 1: UPH (Units Per Hour) — The Leading Indicator Most Factories Only Watch in Hindsight
UPH is the most direct measure of production throughput: how many units a line completes per hour. It’s also one of the most delayed metrics in practice. Most factories know their end-of-shift UPH. Few know it in real time, meaning that a line running at 80% of target for the first six hours of a shift often isn’t addressed until it’s too late to recover the day’s output.
What good looks like: Real-time UPH displayed per line and per station on a production management dashboard, automatically compared against target. Alerts triggered when variance exceeds a threshold, before the shortfall compounds.
What HOP adds: AI vision correlates UPH drops with their root causes, not just flagging that output fell, but identifying why: an upstream station with accumulating WIP, a material replenishment interruption, an operator absence creating downstream starvation. The corrective action is targeted rather than reactive.
Verified outcome: A top-5 global EMS manufacturer deployed HOP across labor-intensive assembly lines in Malaysia and Vietnam. In four weeks, AI-identified root causes — unscheduled absences, replenishment delays, excess WIP — translated into a 5.2% UPH improvement and greater than 5x ROI.
KPI 2: Cycle Time — The Metric IE Teams Are Chronically Under-Resourced to Collect
Cycle Time — the time to complete one work cycle at a station, is the foundational input for line balancing. If a station’s cycle time significantly exceeds Takt Time, it’s the bottleneck constraining the entire line’s output. If it falls well below Takt Time, labor is being underutilized. Neither condition is acceptable, and both require accurate cycle time data across every station to diagnose.
The practical problem is that manual time study methodology can’t produce that data at the density required. An IE team doing manual studies is working with a sample. They’re seeing what happens when they’re watching. They’re missing the variation that occurs across shifts, across operators, across days of the week.
What HOP adds: 24/7 automated Cycle Time measurement via AI vision cameras, covering every station simultaneously. The data isn’t a sample, it’s a complete record. This means line balancing decisions can be made on actual performance distributions, not point estimates. It means variation that only appears on night shifts, or only with specific operators, becomes visible and addressable.
Going from 15 minutes of time study data per month to a continuous, station-level Cycle Time record fundamentally changes what industrial engineering teams can do with the data.
KPI 3: Defect Rate — Measuring What Happened vs. Preventing What’s About to
Defect rate is typically measured at final inspection or at designated quality checkpoints, which means it measures outcomes, not causes. A defect rate of 2% tells you that 2% of units failed inspection. It tells you nothing about where in the process those defects were created, which operators or stations generated them, or what actions produced them.
What HOP adds: AI vision monitors SOP compliance continuously at every workstation. When an operator skips a step, uses the wrong tool, or executes a sequence incorrectly, the deviation is flagged in real time, before it becomes a defect, before it’s sealed inside the product, before it reaches inspection.
This is the difference between defect measurement and defect prevention. A defect rate KPI tells you your quality level. AI vision SOP monitoring changes it.
KPI 4: OEE (Overall Equipment Effectiveness) — The Score That Hides as Much as It Reveals
OEE is manufacturing’s most comprehensive equipment metric, combining availability, performance, and quality into a single score. Industry average sits around 60%, meaning the typical factory is operating at 60% of its theoretical maximum. The gap to 100% represents significant recoverable capacity.
The challenge with OEE as typically measured is that it explains equipment. It doesn’t explain the interaction between equipment and the humans operating alongside it. A line might show 75% OEE on paper while losing hours of productive time to material shortages, operator transitions, or coordination failures between stations, none of which show up cleanly in equipment logs.
What HOP adds: Through IoT sensor integration and open API connectivity with machines, HOP captures equipment state data, running, idle, fault, maintenance, alongside the human-side operational data from AI vision. Both streams feed into a unified management dashboard.
This means a factory manager can answer a question that most systems make surprisingly difficult: Is this efficiency loss coming from the equipment, or from the operations around it? When the data exists side by side, that question becomes answerable in real time rather than after a post-mortem analysis.
KPI 5: Labor Utilization — The Efficiency Lever Most Factories Are Flying Blind On
Over 72% of factory tasks are still performed manually. In labor-intensive assembly, improving operator utilization can deliver gains equivalent to adding equipment capacity — at a fraction of the cost. Source: Kearney — The State of Human Factory Analytics
Labor utilization, the proportion of working time an operator spends in active, value-adding work versus waiting, walking, or idle, is one of the highest-leverage efficiency indicators in manual assembly environments. It’s also one of the least measured.
The reasons are practical. Measuring labor utilization accurately requires knowing, at each station, during each time interval, whether work was happening. That’s not something manual observation can provide continuously. It requires automated activity recognition.
What HOP adds: AI vision classifies operator status in real time — active work, waiting, material-related stops, absence — generating time-stamped labor utilization data across every station and every shift. IE teams can identify which stations accumulate the most idle time, correlate it with upstream causes, and design targeted interventions rather than broad workforce adjustments.
What HOP Makes Possible That Most Factory Systems Don’t
Tracking KPIs is only useful if the data behind them is accurate, timely, and connected to the right decision-makers. HOP is built around three capabilities that address the gap between having metrics and actually managing with them:
1. AI Vision Visualization — Evidence, Not Just Numbers When a KPI anomaly appears, HOP doesn’t just show you the number. It shows you the footage. A spike in Cycle Time at Station 7 comes with the video of what was happening at Station 7 during that window. A defect trace comes with the assembly sequence that produced it. Data stops being abstract and becomes actionable.
2. Automated Data Extraction — Legible to Management, Not Just Engineers HOP automatically extracts the metrics that matter — UPH, Cycle Time, station-level performance, compliance rates — and presents them in a format that operations managers can read and act on without waiting for engineering reports. The right information reaches the right people at the right time.
3. Human + Machine Data in One Platform HOP integrates AI vision data from manual workstations with equipment data from IoT sensors and machine APIs, consolidating both streams into a single management view. For factory managers, this eliminates the constant question of whether a performance issue is human-side or machine-side — the data to answer it is all in one place.
Connecting the KPIs to Outcomes: What HOP Delivers in Practice
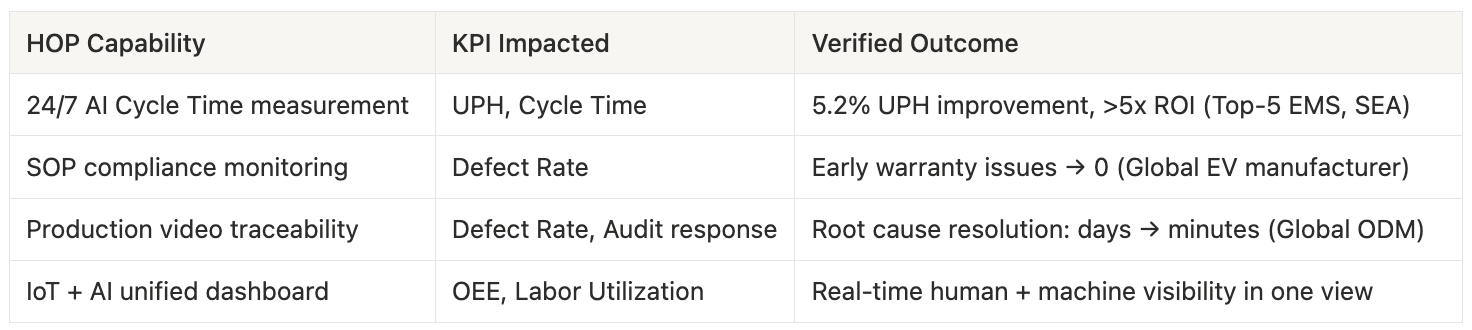
Conclusion
Five KPIs. Five data problems that most factories are currently working around rather than solving. The gap between knowing your numbers and genuinely managing with them is a data infrastructure problem — and it’s solvable with the right platform.
HOP isn’t a reporting tool. It’s the operational layer that makes production data dense enough, timely enough, and visual enough to drive the decisions that actually move metrics. Not just measurement. Management.
Further reading:
Table of Contents