❓What is first pass yield?
First pass yield (FPY) is the share of units that pass a process step correctly the first time, with no rework and no repair. The formula is one line:
FPY = units that pass first time ÷ units that entered the step
Count only units that needed no correction. A unit that was repaired and then passed does not count as first pass.
At the Monday morning review, the monthly quality report says 96%. It has said something close to 96% for five months. The line it describes has fifteen manual stations, and nobody in the room can say which of the fifteen gave away the missing four points, or whether it was three stations losing one point each, or one station having a bad week.
The number is correct. It is also unusable, because it was calculated once, at the end, for the whole line.
That 96%, and the fifteen-station line behind it, are an example that runs through this article. They are not customer data.
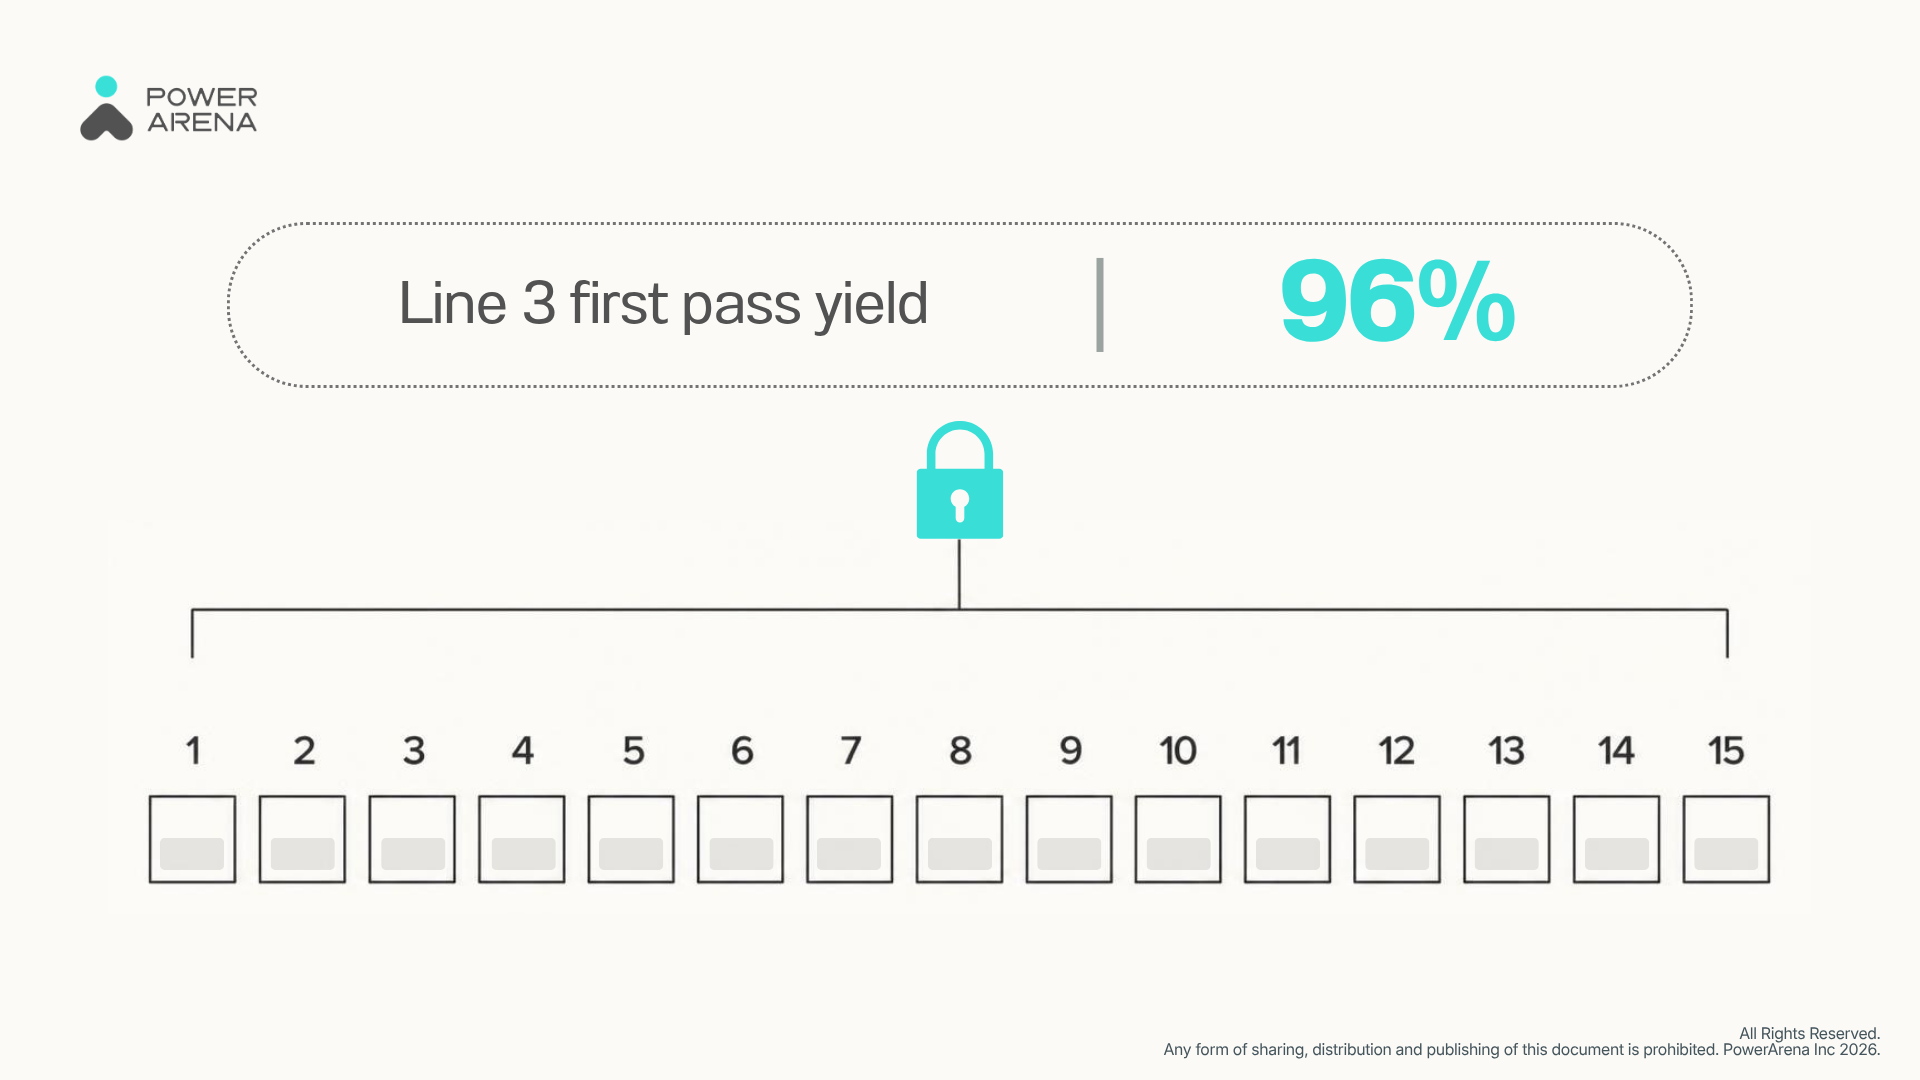
A single line-level first pass yield score hides which specific assembly stations are actually failing.
That gap has a price. Deloitte puts cost of quality at up to 20% of total company sales, and reports that companies spend up to 68% of their total quality costs on correction, meaning rework and scrap internally plus warranty claims and recalls externally, against 32% on prevention. (Deloitte) On those figures, roughly two thirds of the money goes to fixing units already built wrong. Prevention needs to know where the wrong happens, and a line-level FPY number cannot tell you.
📖 This article covers:
- What first pass yield measures at a station, and what a line-level FPY number hides
- The formula, worked across fifteen stations, with the arithmetic mistake that makes a bad line look excellent
- The three places FPY data actually comes from, and what each one can and cannot tell you
- What a semiconductor reticle box line reached once its stations were measured individually
What first pass yield measures, and what it hides
At a single station, FPY answers one question: of the units that went into this step, how many came out right the first time. That definition carries three conditions that get lost in practice.
It is per step, not per line. FPY is defined for a process. Apply it to a whole line and you get a valid number for one very large process, and you lose every station inside it.
Rework disqualifies a unit permanently. If an operator re-seats a connector that had stopped a click short of the latch, or a technician reflows a joint and the unit goes from fail to pass, that unit is still not first-pass good. Traditional yield counts it as good, because traditional yield asks whether you can ship it. FPY asks what it cost you to get there.
Scrap and rework are both misses. A scrapped unit and a repaired unit look very different on the P&L, your profit and loss statement. To FPY, though, they are the same event: the step did not work the first time.
The hiding happens at the rollup, the moment fifteen station numbers become one line number. A line-level FPY of 96% compresses everything that happened across fifteen stations into one figure, and the compression is not reversible. Four points went missing. You cannot get them back out.
A yield number tells you how many. A yield number per station tells you where. Shifting the question from how many to where, and the answer has to come off the stations themselves.
The formula, and a worked example across fifteen stations
On a fifteen-station enclosure assembly line, here is the arithmetic. These figures are an example, chosen to be realistic, not customer data. One month, 10,000 units entering each station, with reworked units counted as non-first-pass at the station where they failed.
| # | Station | Units in | First-pass good | Station FPY | Cumulative RTY |
| 1 | Housing load and align | 10,000 | 9,994 | 99.94% | 99.94% |
| 2 | Gasket seat | 10,000 | 9,961 | 99.61% | 99.55% |
| 3 | PCB mount | 10,000 | 9,988 | 99.88% | 99.43% |
| 4 | Screw drive, 4 points | 10,000 | 9,972 | 99.72% | 99.15% |
| 5 | Connector A | 10,000 | 9,983 | 99.83% | 98.98% |
| 6 | Connector B | 10,000 | 9,979 | 99.79% | 98.78% |
| 7 | Thermal pad application | 10,000 | 9,948 | 99.48% | 98.26% |
| 8 | Shield can fit | 10,000 | 9,990 | 99.90% | 98.16% |
| 9 | Label and scan | 10,000 | 9,996 | 99.96% | 98.12% |
| 10 | Torque verification | 10,000 | 9,976 | 99.76% | 97.89% |
| 11 | Cable routing | 10,000 | 9,934 | 99.34% | 97.24% |
| 12 | Cover close | 10,000 | 9,981 | 99.81% | 97.06% |
| 13 | Screw drive, 6 points | 10,000 | 9,969 | 99.69% | 96.76% |
| 14 | Firmware flash | 10,000 | 9,993 | 99.93% | 96.69% |
| 15 | Final visual | 10,000 | 9,987 | 99.87% | 96.56% |
Station 4 as a worked line: 9,972 ÷ 10,000 = 0.9972, so 99.72%.
The last column is rolled throughput yield (RTY), the probability that a unit passes all fifteen stations first time with no rework anywhere. You get it by multiplying the station yields, not by adding them:
RTY = FPY₁ × FPY₂ × … × FPY₁₅ = 0.9994 × 0.9961 × … × 0.9987 = 96.56%
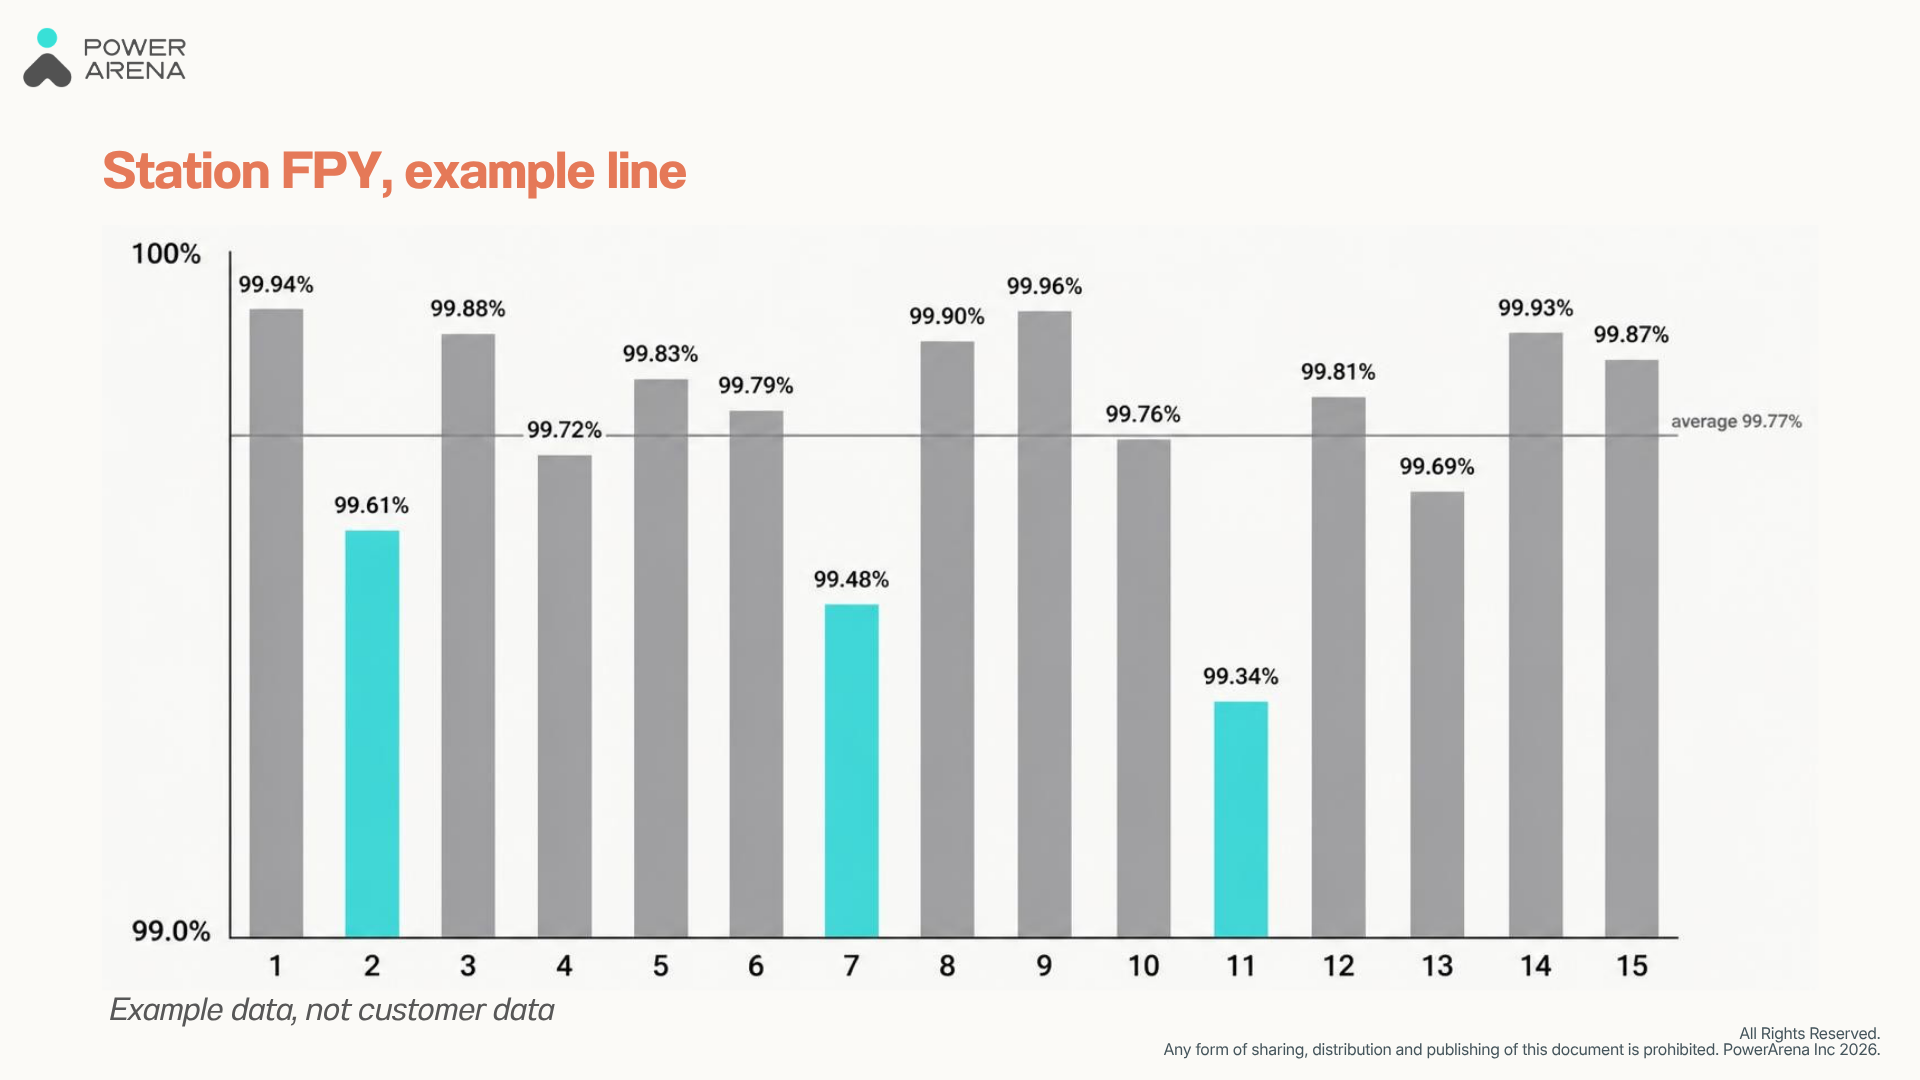
Station-level data reveals that just three stations account for the majority of first-pass failures.
The mistake that makes a bad line look excellent
Take the fifteen station FPYs in that example table and average them. You get 99.77%. Put that in a slide and the line looks close to flawless.
Multiply them instead and you get 96.56%. The same data, 3.2 points apart.
Averaging is wrong because yields in series are probabilities, and probabilities in series multiply. Every station gets its shot at the same unit. It is also why long lines punish small defect rates so hard: fifteen stations at 99.77% each produce a line that misses more than three units in every hundred, and those three end up on your rework bench, or in the hands of your customers.
The same table answers the question the rollup could not. Across 150,000 station passes in the example there were 349 misses. Three stations, 11 (cable routing), 7 (thermal pad) and 2 (gasket seat), account for 157 of them, 45% of every first-pass failure on the line. Bring those three up to the line’s own average station rate of 99.77% and RTY moves from 96.56% to 97.42%, about 86 more units per 10,000 that never need touching twice.
You cannot see any of that in a 96%.
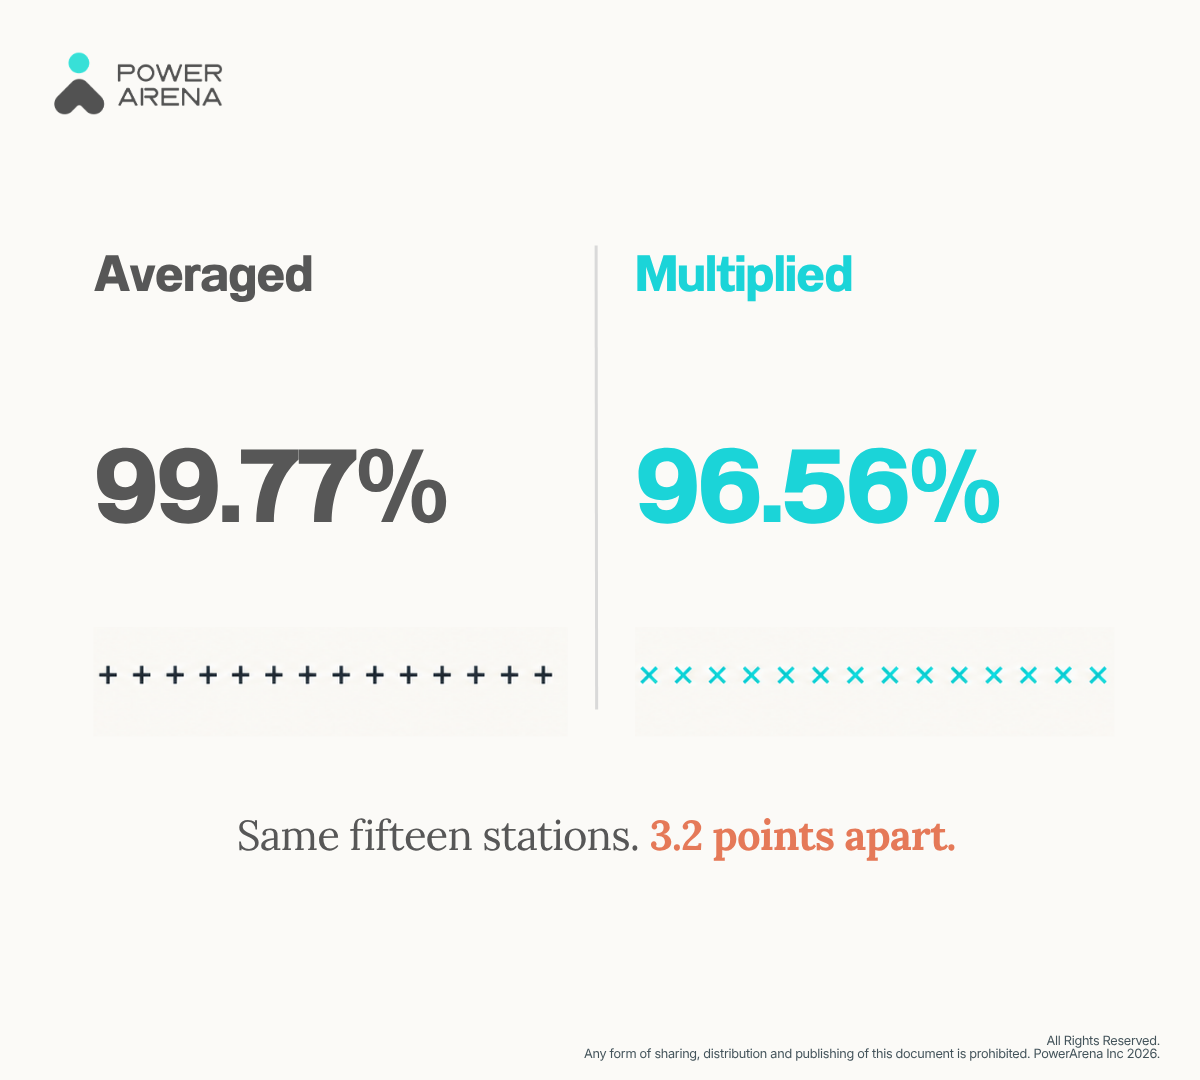
Station yields must be multiplied, not averaged, to accurately calculate true line yield.
Where the data has to come from, and what each source was built to tell you
The formula took a minute. Filling it in is what stops most lines, because FPY per station needs one fact your systems may not record: was this unit good at this step, before anyone touched it again. Three sources exist, and each is honest about something different.
End-of-line test records: complete, but late and station-blind
At the end of the line, functional test and final inspection cover every unit. The pass or fail is objective, timestamped and already in your database. That is real coverage, and in most factories it is where the FPY figure on the monthly report comes from.
The limitation is positional. End-of-line test sees a finished unit, so it reports that the unit failed, not where it went wrong. It is also blind to any step whose result never shows up at final test: adhesive coverage under a closed housing, or a gasket seated at a slight angle that holds on the test bench today and starts leaking in the field in month seven. So your 96% is a true statement about the end of the line, and it says nothing at all about the middle of it.
Operator-entered rework tickets: station-attributed, but under-reported
Back at the bench, rework tickets are the only common source that names a station. When a ticket says “station 11, cable pinched, re-routed”, you have exactly the fact FPY needs: the unit was not good at station 11, and somebody made it good afterwards.
The trouble is what gets a ticket. A failure that takes twenty seconds to correct in place, by the person who made it, usually does not. That is not dishonesty on your floor. It is a person fixing a small thing and moving on, in a job measured on output, and no ticketing system beats that instinct reliably. So your tickets skew toward failures that were slow, visible or expensive, and station-level FPY built from them runs optimistic in a way you cannot correct for, because the missing events left no record. Maybe one of them comes back later as a field return, maybe never.
Continuous vision capture: per station, per unit, per step
At each station, this is where PowerArena HOP (Human Operation Platform) sits. Cameras watch the work against that station’s own SOP (standard operating procedure), and every unit gets a record: which steps were performed, in what order, how long each took, whether a step was repeated. A repeated step is a first-pass miss, whether or not anyone filed a ticket for it.
Three things follow for the FPY calculation. Coverage is every unit rather than a sample. Attribution is per station by construction, because the camera is at the station. And the timing changes: the andon above the bench, the light tower the whole line reads at a glance, turns from green to red while the unit is still in front of the operator, so the event that would have become a rework ticket becomes a correction instead.
The manual alternative deserves credit before it gets replaced. Hand-collected time and yield studies are how this data was gathered for most of the last fifty years, and the people doing them were rigorous. The problem is arithmetic, not diligence: in the PowerArena corpus, 24 to 48 hours of engineer time on the floor yields roughly 15 minutes of usable data per month. That is a sample of one shift at one station. It cannot populate the fifteen-row example table above, and it cannot populate the real one your improvement plan needs.
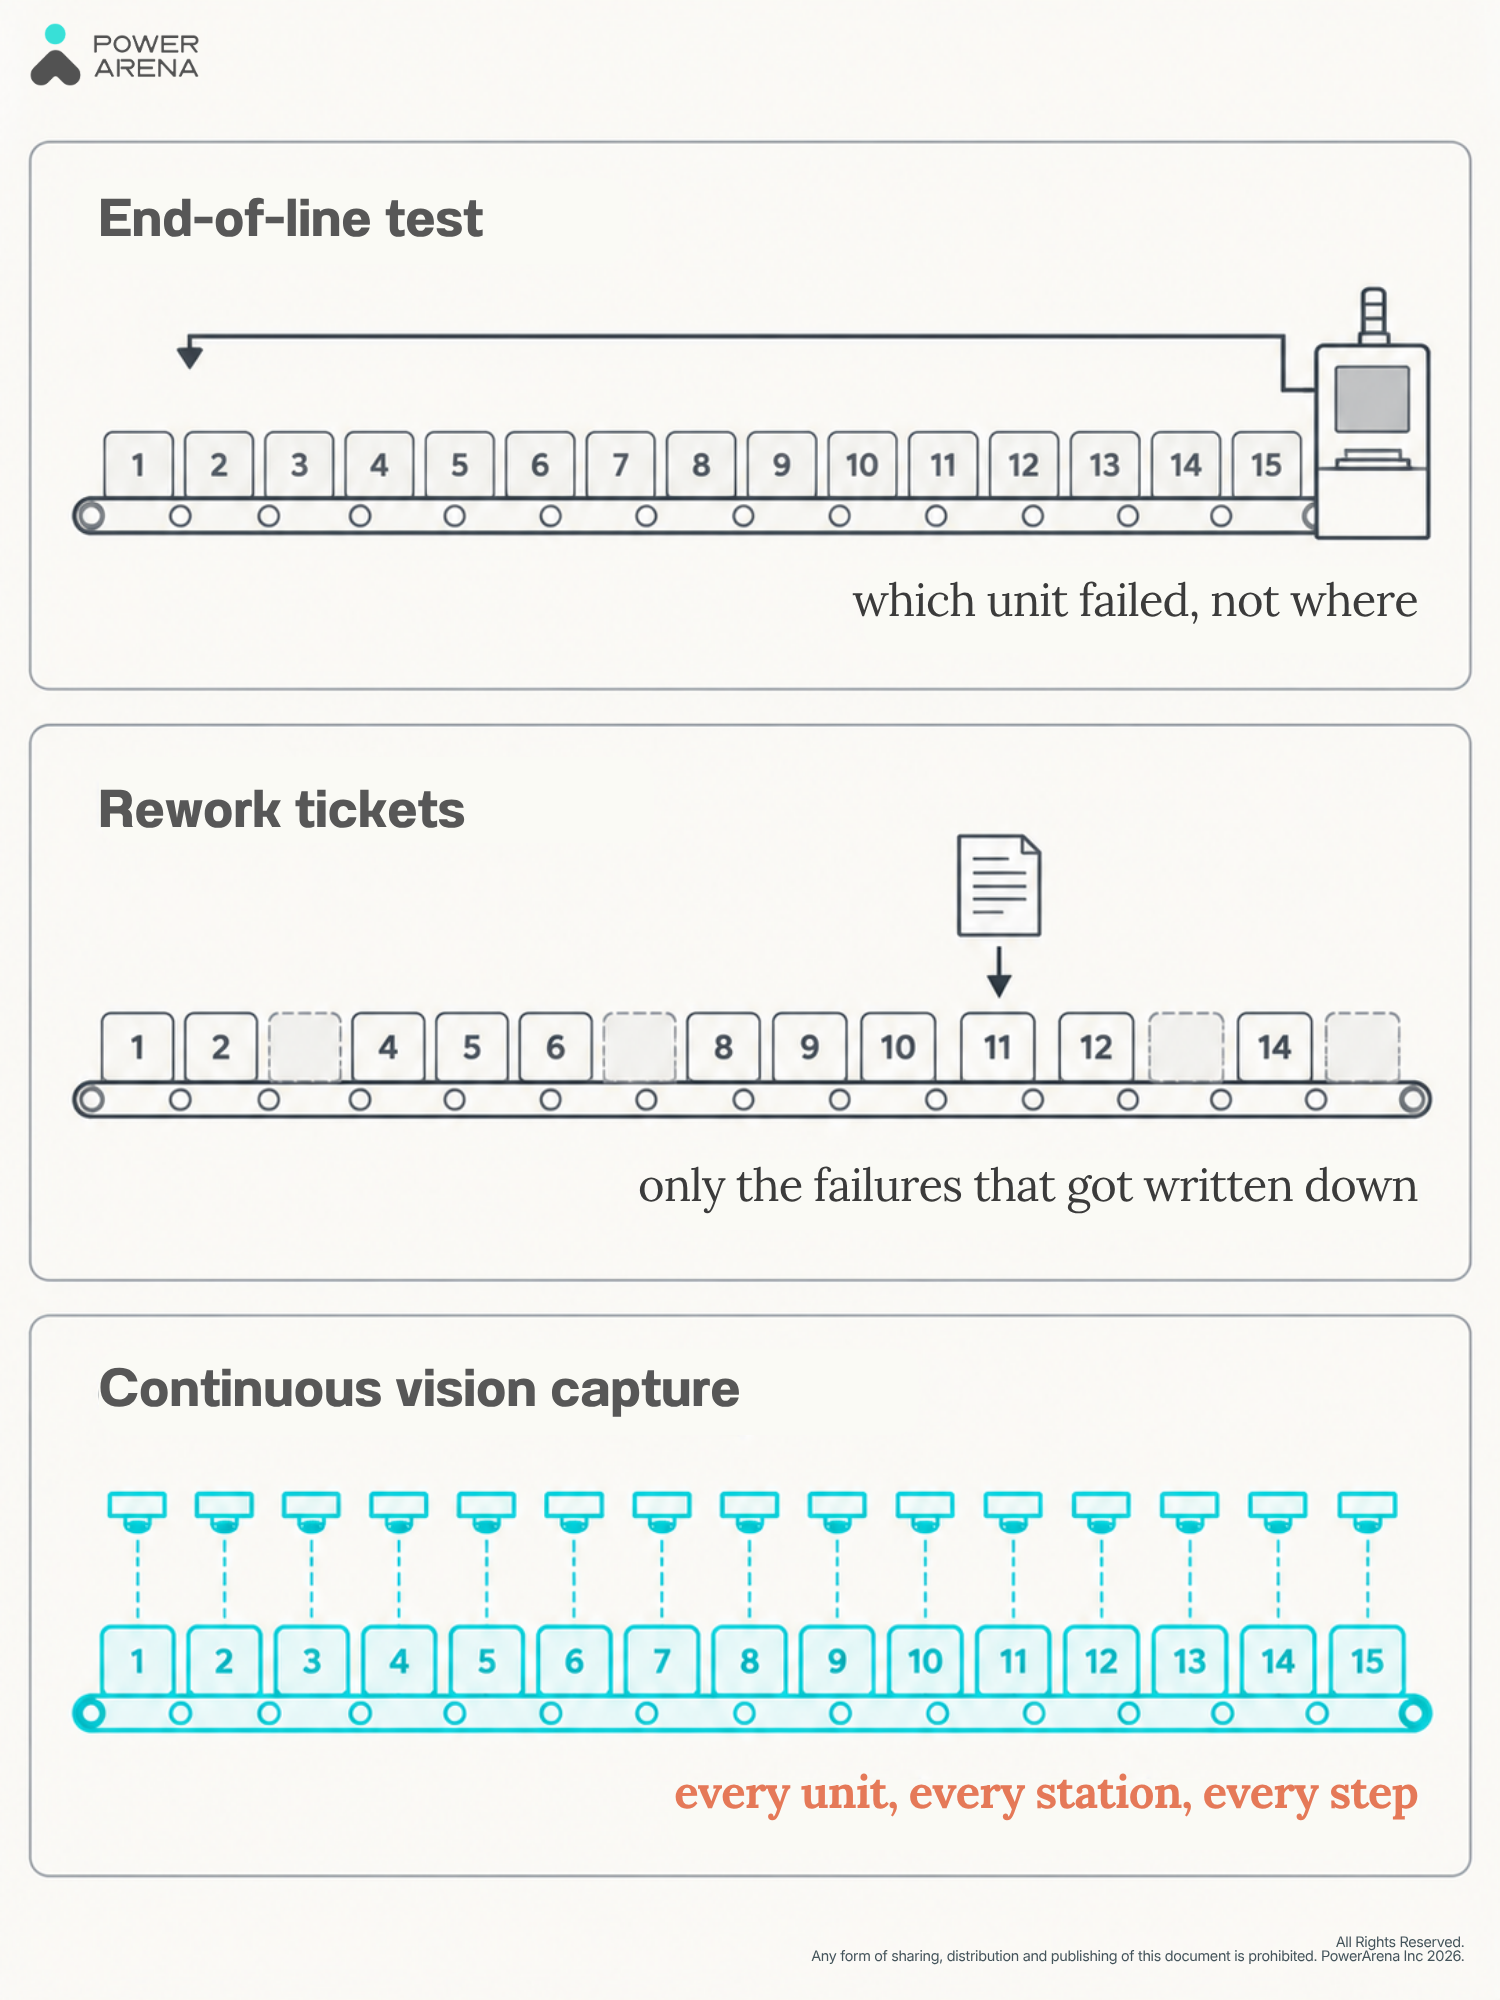
Comparison of end-of-line test, rework tickets and continuous vision capture.
Manual capture vs continuous capture, on the four things that decide it
| End-of-line test records | Operator rework tickets | Continuous vision capture | |
| Coverage | Every unit, one measurement point | Whatever gets reported, biased to slow and costly failures | Every unit, every station, every shift |
| Latency | Minutes to hours after the unit is built | Hours to days, at ticket close | Seconds, at the station |
| Station attribution | None, the unit is finished | Yes, when a ticket is filed | Per station and per step, automatically |
| Effort per month | Near zero, already collected | Operator and supervisor time on every event |
Setup once, then no recurring collection labor
|
None of these sources is fake. End-of-line data is the most trusted number in your factory and should stay that way, it works just fine for what it was built for, and tickets are how your team already thinks about failure. What neither can produce on its own is a table with fifteen rows in it.
Five things that move first pass yield, in the order they usually pay
1. Get attribution before you get ambitious. Until you can split the line number by station, every improvement is a guess with a budget attached. This is the cheapest step, and it is the one most often skipped.
2. Fix the top three stations, not the average. In the worked example above, three stations held 45% of the misses. Spreading effort evenly across fifteen stations spends most of it on stations that are already fine.
3. Move correction from end of line to the station. Price the same miss twice. At the station: one redo, no paperwork, nobody else involved. At final test: a teardown, a ticket, a retest, and a unit that has now passed through three people’s hands. The defect is identical in both cases. Only the invoice differs, and it is your invoice.
4. Make the SOP precise enough to be checked. Much of the station-level FPY loss on a manual line is not a hard defect, it is variation: a thermal pad laid down off center, hands crossing, the sequence drifting on the night shift. HOP’s Digital Station module puts the current step on screen at the station, which shortens new-operator ramp and settles the “which way did the veteran do it” question.
5. Balance the line, then re-measure. A station 8 seconds over takt (takt is the pace the line has to hold to meet demand) produces rushed work, and rushed work fails first pass. HOP’s AI Line Balancing module measures per-station cycle time on every unit rather than on sampled ones, which is the input a real rebalance needs: how to master line balancing in lean manufacturing.
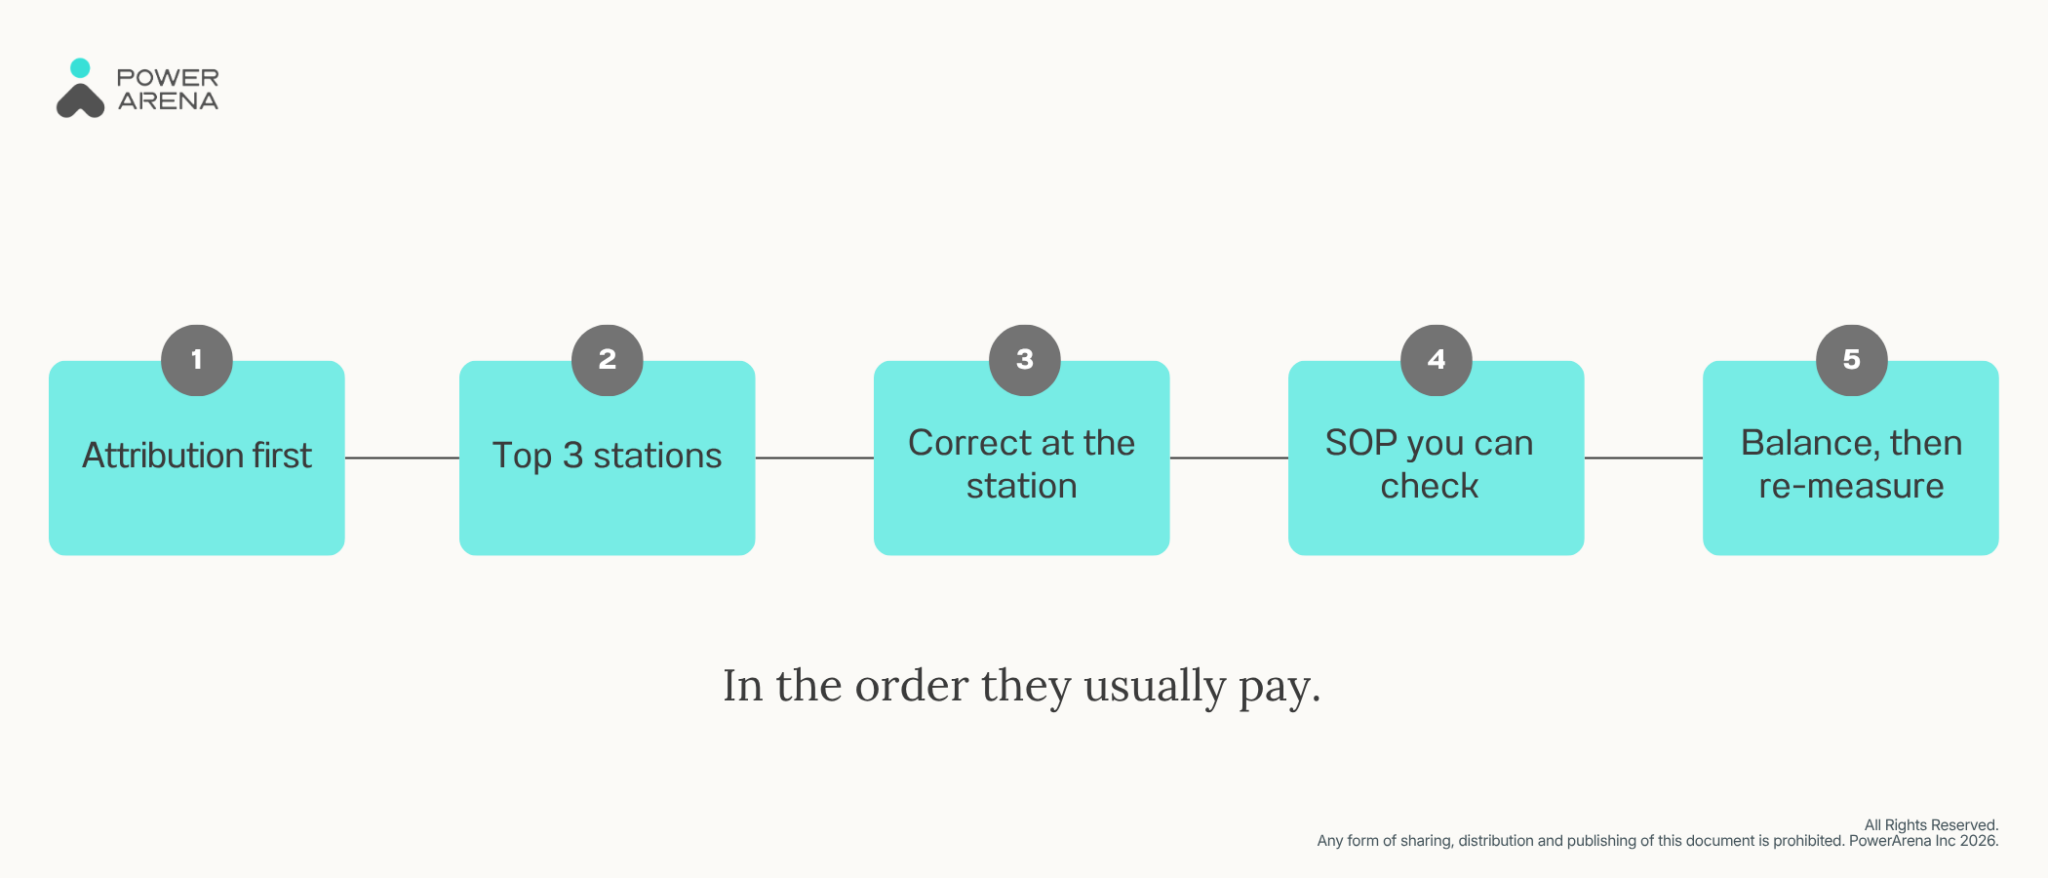
Five strategies to improve your FPY and reduce costly rework.
Case: a semiconductor reticle box line, measured station by station
For over 25 years this customer has built photomask carriers, wafer carriers and substrate carriers. The reticle box assembly station is manual and dense, one operator running a long sequence of steps on a high-value product. Their yield problem had the shape described above: new hires had no experience to fall back on, veteran operators had their own habits, and nobody could quantify an improvement because the per-station data to quantify it did not exist.
HOP went in at that station. Continuous recording replaced stopwatch timing, cycle time was measured on every unit instead of on sampled ones, and an incorrect step or an abnormal pause raised an alert at that station, naming the step, instead of a finding at final test hours later. The SOP was rewritten to the precision the model needed: part placements, tool positions, left and right hand assignments. That rewrite turned out to be worth doing on its own.
Results: yield held at 95%, first pass yield reached 97.6%, cycle time fell from 3.5 minutes to 2.8 minutes, and UPH (units per hour) rose 19%.
Their industrial engineer put it this way: “We used to rely on experience to identify issues. Now, with video and data, we pinpoint bottlenecks and justify improvements with confidence.”
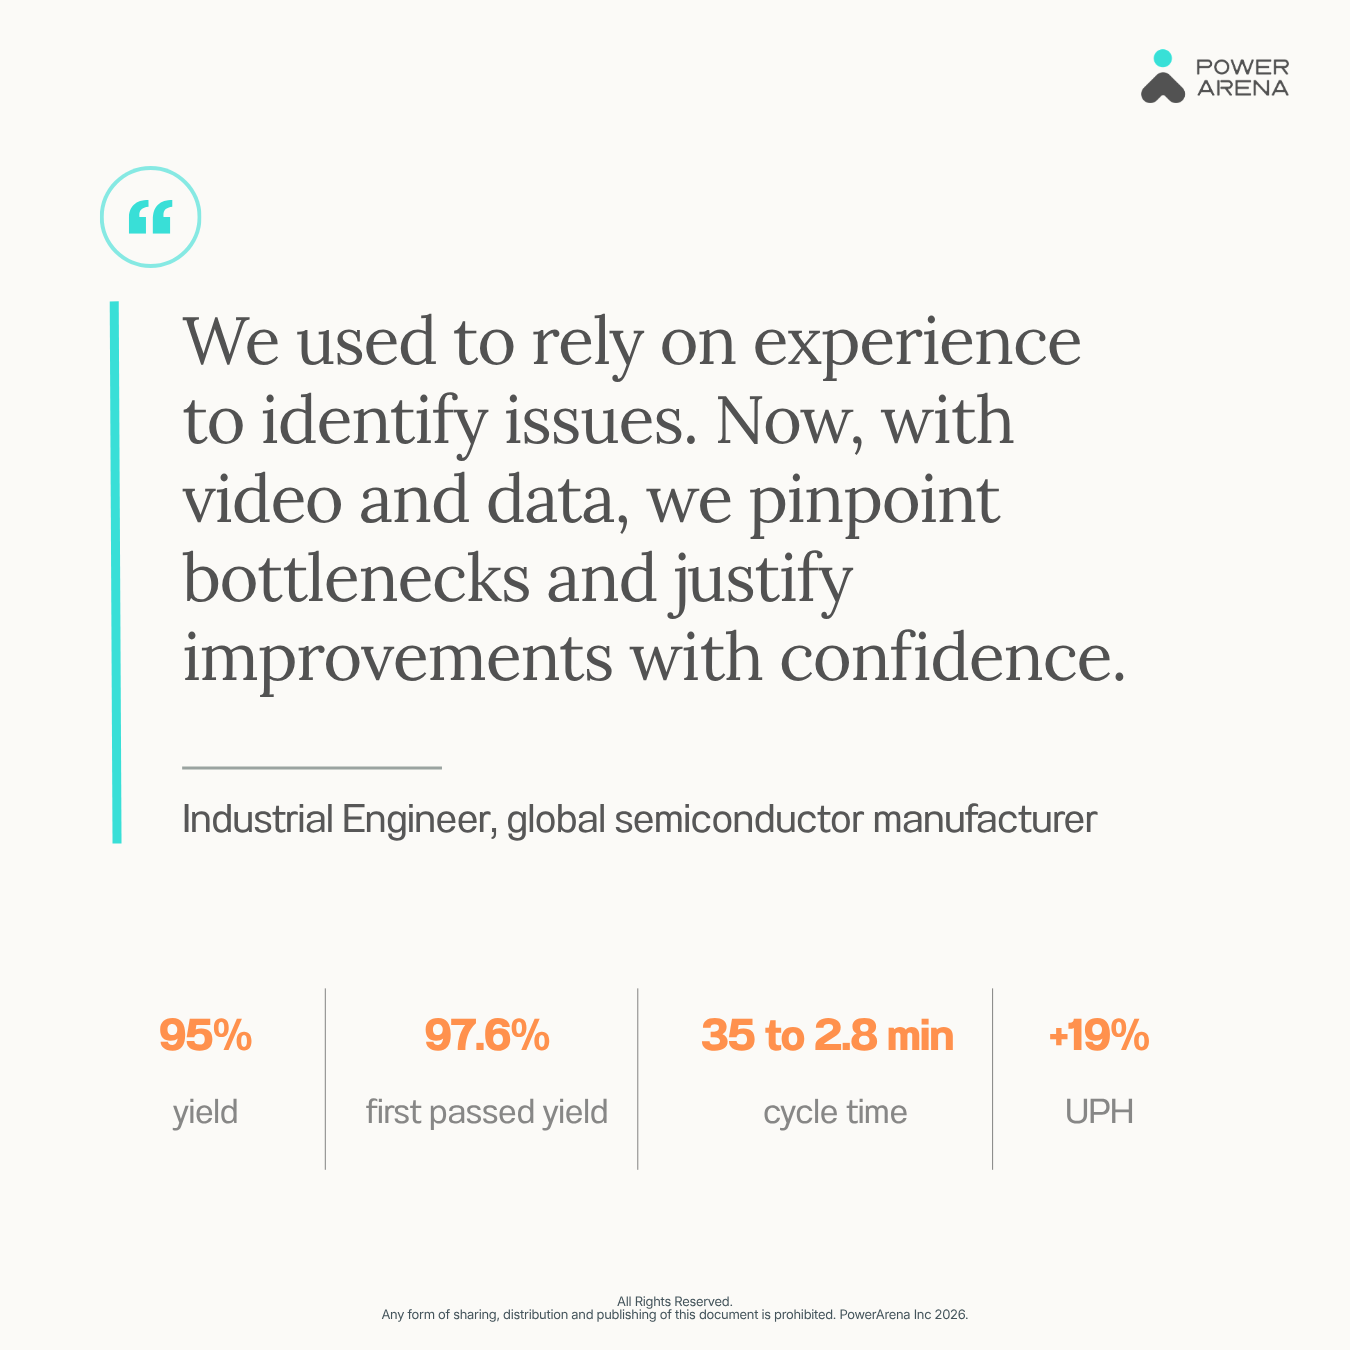
How continuous video data improved FPY and boosted UPH on a manual assembly line.
The FPY number is the one to read twice. A first pass rate above the overall yield rate means the units that were good were good the first time, with the rework path carrying very little traffic. That is the condition you are actually trying to buy. More on the yield side of this line: keeping yield at 95% with AI in semiconductor manufacturing.
FAQ
What is first pass yield?
First pass yield is the percentage of units that pass a process step correctly the first time, without rework, repair or adjustment. It is a measure of how well a process runs, as opposed to final yield, which measures what you can ship after correction.
What is the first pass yield formula?
FPY = units that pass first time ÷ units that entered the step. In the example table above, 10,000 units enter station 4 and 9,972 come out right without being touched again, so FPY is 9,972 ÷ 10,000 = 99.72%. Reworked units are excluded from the numerator.
What is a good first pass yield?
It depends on step count and product, so ask about the method before judging the number. On a fifteen-station manual line, station-level FPY in the high 99s is commonly reported, and a rolled figure in the mid 90s follows from it mathematically. A reported 96% with no station breakdown is not yet a good or a bad number, because you do not know what it is made of.
What is the difference between FPY and rolled throughput yield?
FPY is per step. Rolled throughput yield (RTY) is the whole sequence: multiply every station’s FPY together to get the probability that a unit passes all of them first time. In the worked example above, which is an illustration rather than customer data, the fifteen station yields average 99.77% but multiply to 96.56%.
How do you measure first pass yield per station?
You need each unit’s result at each step, before any correction. End-of-line test data cannot supply it, because the unit is finished. Rework tickets supply it only when a ticket gets filed. Continuous vision capture records every unit and every step, including the twenty-second in-place fixes that never reach a ticketing system.
Where to take this next
One formula, one example line, three places the data can come from. If you want to go one layer deeper on any part of it, these are the places to start.
Related reading
- Keeping yield at 95% with AI in semiconductor manufacturing. The yield side of the reticle box line above: how 95% is held once a dense manual station is measured on every unit.
- How to master line balancing in lean manufacturing. Lever 5 in full: per-station cycle time measured on every unit, and the 5.2% UPH gain a 15-station EMS line took from it.
- 5 production line KPIs every factory manager should be tracking. Where FPY sits next to UPH, cycle time, OEE and labor utilization, and why a defect rate counted at final inspection measures outcomes rather than causes. The 24 to 48 hours of IE time figure comes from here.
Case studies
- Semiconductor manufacturer improves product quality with HOP AI Poka-Yoke. The full reticle box deployment: the 10 to 30 step station, the SOP rewrite, and where the 97.6% came from.
- Achieving productivity improvements on a matured line. A switch manufacturer’s 30-station golden line, 16 of them put under cameras. The project manager’s own words on why asking operators what happened did not work are the rework-ticket problem above, seen from the floor.
See it on your own line
The fastest way to find out what your 96% is made of is to pick the three stations you suspect most and measure them on every unit for a month. Bring the monthly report.
Book a consultation to see first pass yield measured station by station:
Table of Contents