
❓What is AI quality control?
AI quality control uses computer vision and machine learning to judge quality during production rather than after it. It can be pointed at three things: the part, the process that produced the part, and the record both leave behind. Most systems on the market, going by what their demos actually show, inspect only the part, and that one choice decides what they are able to catch.
On the line, a screwdriver slips and scratches a server casing. The operator does not notice. The unit goes down the line and four hours later an inspector at end of line finds the mark, pulls the unit, logs it as cosmetic, sends it to rework. Everyone does their job correctly.
What nobody can recover, once the unit is off the line, is which of the four operators who handled that casing made the mark, at which station, with which tool, or whether it has happened 30 times this month and you are only seeing the ones the inspector caught.
The defect was found. The cause was not.
That gap has a price attached. Warranty costs across the automotive industry reached roughly $58 billion globally in 2024, about 2.2% of industry sales, and at some OEMs they now pass 4% of revenue, which puts them alongside the annual R&D budget. In the same survey, though, only 18% of respondents said their organization uses AI or machine learning in production to predict quality issues. (McKinsey, June 2026) Those are the defects that reached your customer before anybody at your plant did, and they land on your budget quarters later.
📖 This article covers:
-
- The three layers AI quality control can operate on, and what each one catches
- Why end-of-line inspection finds the defect and misses the cause
- AOI (automated optical inspection), machine vision and AI vision on people, compared in one table
- The three places AI quality control pays back first
- What a semiconductor reticle box line changed, and the numbers it moved
What AI quality control means in a factory, not in a demo
In a vendor demo, what you are usually shown is one thing: a model finding a scratch on a surface. It is a good demo. However, it is one layer out of three, and if you buy the demo, the layer is what you get.

The three layers of production data analysis.
Layer 1: inspecting the part, the layer every demo was built to show
At end of line, or at a dedicated inspection position part-way down it, automated optical inspection, machine vision and surface defect models judge the physical output: scratches, dents, discoloration, missing components, dimensional deviation, print quality. Cameras are fixed, lighting is controlled, and the trigger is a part arriving in the frame. This layer is mature, and it works just fine.
What it gives you is a pass or a fail on a finished item. What it cannot give you is any account of how the item got that way.
Layer 2: verifying the process, the layer that watches the work instead of the workpiece
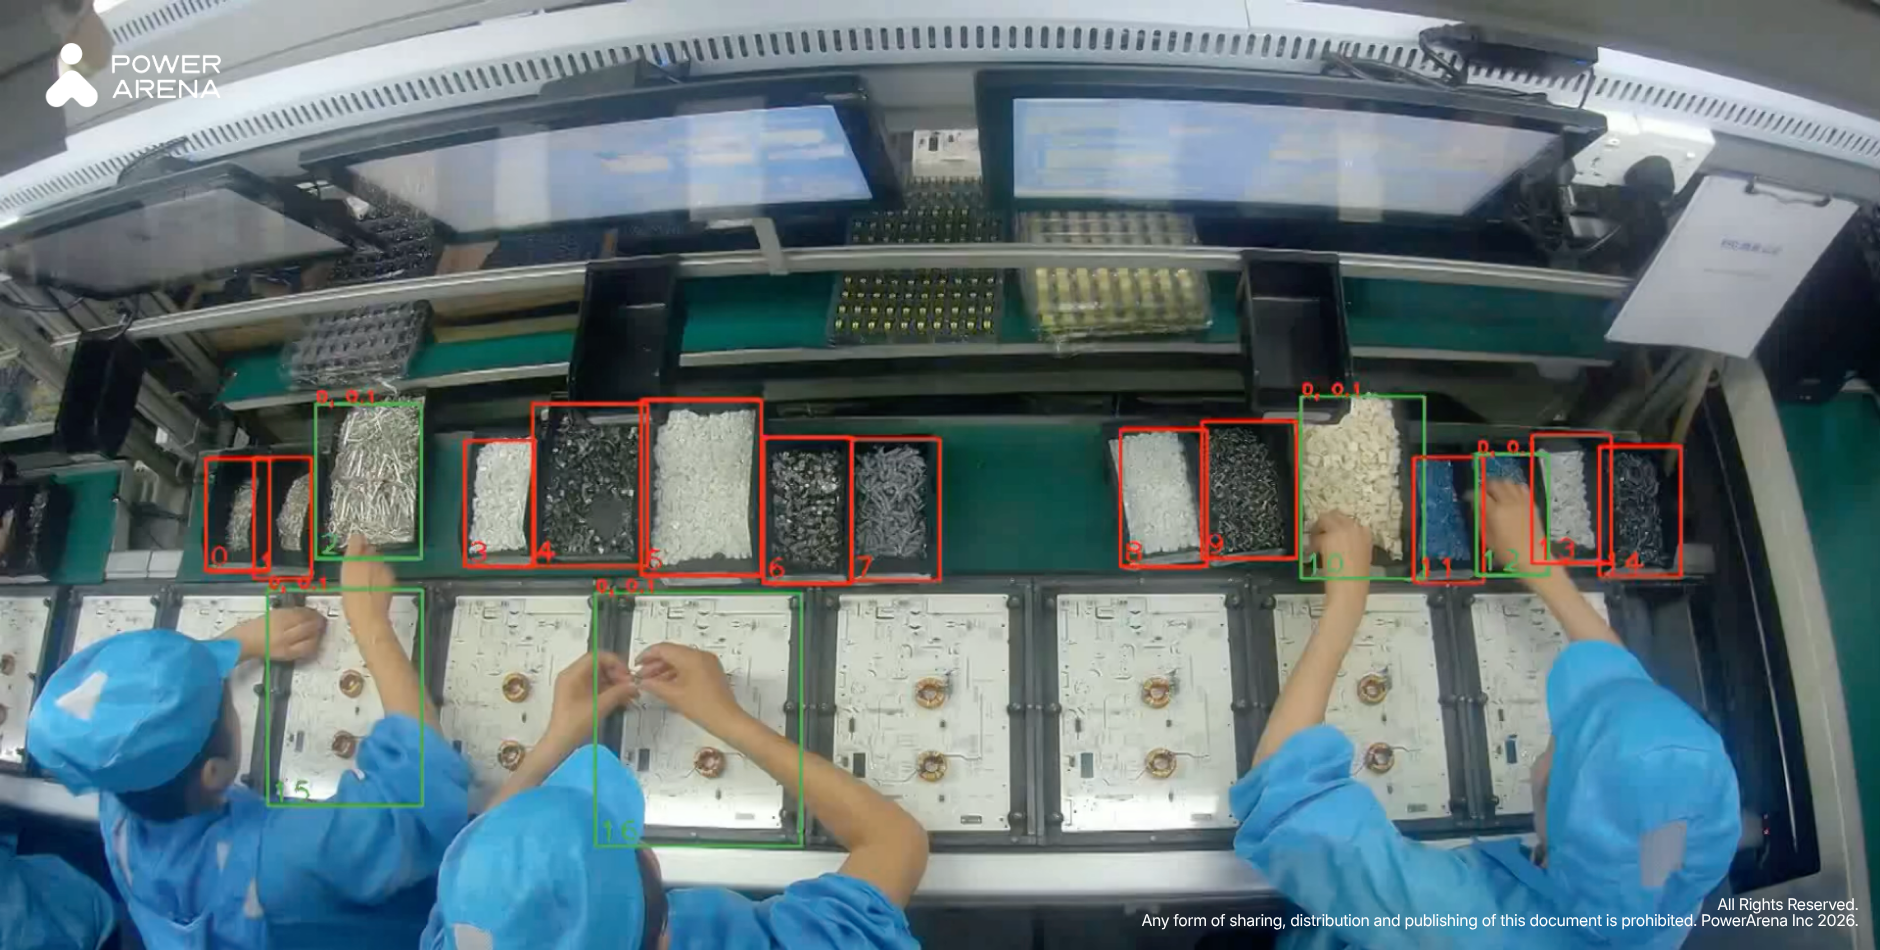
Back at the station itself, action recognition watches the work rather than the workpiece. Which tool came off the rack, the torque driver or the one still set for the previous model. Whether step 4 came before step 5. How long the operator stood waiting for the fixture to release. Whether the second person at the station completed their half of the sequence, or moved on when the line pushed. The trigger here is a human action, not a part in frame.
What it gives you is a record of how the unit was built, while the unit is still standing in front of the person who built it.
Layer 3: analyzing the record, where the first two layers are supposed to end up
Once layers 1 and 2 write to one record indexed by serial number, station, shift and operator, quality work changes character. Root cause analysis stops being an exercise in reconstruction. Corrective action has evidence attached. FMEA (failure mode and effects analysis) gets populated with failure modes somebody observed rather than failure modes somebody remembered.
What it gives you is the ability to answer questions that were previously unanswerable, starting with the one every quality meeting opens on: which station is this recurring defect entering at.
Why end-of-line inspection finds the defect and misses the cause
End-of-line inspection is a detection system running after the only moment when correction was cheap. That is not a criticism of the method. It is a description of what its position on the line permits.
Look at what the position costs you. The unit is complete, so correction means rework or scrap rather than an adjustment. The housing is closed, so any internal step is now beyond verification. The operator has built another 300 units or so under the same conditions, so if the cause was a habit, the habit has already produced a batch. And the record shows a fail without showing what preceded it, so the investigation opens with your own engineers rebuilding a shift that ended three weeks ago out of memory and a spreadsheet.
None of that is the inspector’s doing. Put the same person, with the same eye, at a screen watching the station instead of the pallet, and the same mark gets found four hours earlier, with the housing still open and the operator still standing in front of the unit. The method is not the weak part here. The position on the line is.
Machine vision asks: is this product defect-free? AI vision on people asks: is this operator doing the job correctly? Both questions deserve an answer. Only the second one arrives in time to change the answer to the first.
AOI, machine vision and AI vision on people: what each one was designed to see

Core differences between AOI, Machine Vision, and AI Vision.
| AOI | Traditional machine vision | AI vision on operator actions | |
| What it inspects | Boards and assemblies against a reference image | Parts, dimensions, presence, position |
The sequence of human actions at a station
|
| What triggers it | A part entering a fixed inspection position | A part entering the field of view |
Any action, continuously, whether or not a part is present
|
| What it produces | Pass or fail plus a defect map | Pass or fail plus measurements |
A step-by-step record with timing, plus real-time alerts
|
| Where it fails | Only sees what the programmed inspection covers | Rule-based, sensitive to lighting and variation, blind to novel defects |
Needs a defined SOP and a clear camera view; will not judge internal part quality
|
| Best used for | High-volume electronics with stable designs | Repeatable geometric checks |
Manual, high-mix, multi-step assembly
|
The two rows vendors leave out of the brochure are the last two. Everything on this table has a boundary, though, and the expensive mistake is not picking the wrong column. It is buying the third column for a problem the first column already solved, or the reverse.
Three places AI quality control pays back first
None of the three below needs the full three-layer stack to start paying for itself. Each is a separate business case, and in most plants they arrive in roughly this order.
Continuous data where stopwatch studies produce minutes
You know the method already: an industrial engineer with a stopwatch and a clipboard, picking stations at more or less random times of day, catching whichever operator happens to be there. Across a month, 24 to 48 hours of that work yields about 15 minutes of usable data. Every improvement decision that month rests on those 15 minutes, collected on the days somebody was free to stand there.
A camera at the same station gives you cycle time on every unit, including the ones built at 02:00 on the night shift.

Manual stopwatch sampling versus continuous camera data
Real-time alerts at the station rather than reports at end of shift
A deviation caught in seconds is a correction: the station board turns from green to amber, and the operator fixes it with the unit still clamped in front of them. The same deviation caught at end of shift is an investigation. Caught at end of line, it is rework. The technical difference is latency. The difference you will feel is how many units are involved by the time anyone knows.
Traceability that survives a customer complaint
When a complaint lands on your desk with a serial number in it, one question matters: what happened to that unit. Parameter logs answer it partly. A record of the assembly itself answers it fully, in minutes, and either clears the process or tells you the station. The half people forget is the first one. A complaint that turns out to be transit damage rather than assembly is a completely different conversation with that customer, and you can only have it if the build of that unit is on record.
Case: a semiconductor reticle box line
This customer has been in precision manufacturing for over 25 years, building photomask carriers, wafer carriers and substrate carriers. Their assembly is manual and dense. As PowerArena’s AI Director Kuei Huang described the problem to Digitimes, in cell production workstations “each operator may be responsible for 10 to 30 assembly steps, and any oversight in a critical step can lead to a significant reduce yield in subsequent processes.” (Digitimes) Cell production means one operator, or a small team, completes many steps on a unit, instead of one step on many units.
- The problem. New hires had no experience to fall back on and veteran operators had habits of their own, so quality moved with the shift roster. Nobody could quantify an improvement, though, because the data to quantify it did not exist.
- The change. PowerArena HOP (Human Operation Platform) went in at the reticle box assembly station: continuous recording, automated cycle time measurement in place of stopwatch studies, and real-time alerts on incorrect steps and abnormal pauses.
- The SOP work. Part placements, tool positions and left and right hand assignments were defined precisely. The AI model needed that. The process turned out to need it too.
- The numbers. Cycle time fell from 3.5 minutes to 2.8 minutes, UPH (units per hour) rose 19%, yield held at 95% with a 97.6% first pass rate.
“We used to rely on experience to identify issues. Now, with video and data, we pinpoint bottlenecks and justify improvements with confidence.” — PowerArena customer’s industrial engineer.
Their industrial engineer put the change more plainly than a results table can: “We used to rely on experience to identify issues. Now, with video and data, we pinpoint bottlenecks and justify improvements with confidence.” Their production line manager added the line that tends to matter in a review meeting: “HOP provides complete visual data, enabling improvements based on facts, not assumptions.”
PowerArena’s work in this area was recognized with a Frost & Sullivan Best Practice Award in 2022.
Deployment checklist: six things to settle before the first camera goes up
- Name the station. Choose the one where manual steps decide yield, not the one with the easiest cable run. Walk the line once with the yield report in your hand and, on most floors, it names itself.
- Write down what you cannot verify there today, and what evidence would satisfy you. One page, in the words your own quality team already uses.
- Check the SOP is precise enough to be checked against: sequence, tools, hand assignments, what counts as done. If two experienced operators read it and then work differently, it is not precise enough yet.
- Decide who gets the alert, and what you expect that person to do in the next 30 seconds. Name the person, not the role.
- Agree the baseline before anything is installed. Cycle time, FPY (first pass yield) and rework rate measured the old way, so the comparison holds up when someone senior questions it.
- Settle data handling with HR and your works council (the employee representative body, where your site has one) before the install, not after. This one is worth doing early. Bring them the camera angle and the retention period, not the slide deck.
📖 FAQ
What is AI quality control?
AI quality control applies computer vision and machine learning to quality judgments during production. It works on three layers: inspecting the part, verifying the process that produced it, and analyzing the combined record.
How is AI quality control different from machine vision?
Traditional machine vision applies programmed rules to a part in a controlled position and answers whether the part conforms. AI-based systems learn from examples, tolerate variation, and can be pointed at human actions rather than only at parts.
What data does AI quality control need?
For part inspection, labeled images of good and defective units. For process verification, a defined SOP and a clear camera view of the station. Both need a baseline of current performance, or the results will not mean much to anyone in the room.
How long until AI quality control pays back?
It depends on what the station costs you when it goes wrong. Lines where one missed manual step causes downstream yield loss or a field failure pay back fastest, because the avoided cost per event is large.
Does AI quality control replace inspectors?
It changes what they spend the day on. Continuous checking moves to the system; your people take the judgment calls, the root cause work and the process improvement. In the reticle box case, engineers stopped timing operations by hand and went to work on the process instead.
Where to take this next
You came here to work out which layer your quality problem sits on. These are the pages that answer the question you are most likely to ask second.
Related reading
- Machine vision vs AI vision in manufacturing inspection. If the table above settled the difference but not the buying decision, this is the long version of that comparison.
- Does AI vision enhance FMEA?. Layer 3 in practice: what changes in your FMEA when the failure modes come from observation instead of memory.
- What is HOP: 6 steps to ready your factory for AI deployment. The checklist above, taken further, for the person who has to actually schedule the install.
- Yield and AI in semiconductor manufacturing. Read this one if a single missed manual step in your process costs you yield downstream rather than a cosmetic reject.
Case studies
- A precision manufacturer’s reticle box line. The full version of the case above, including the SOP work that had to happen before the model could be trained.
- Line balancing at a top-five EMS. For readers whose real problem is throughput spread across many stations rather than defects at one.
The module behind the case
Digital Station is the part of HOP that does layer 2 and layer 3: it records the work at a station, measures cycle time on every unit, alerts on the wrong step, and keeps the build record your next customer complaint will need. Worth a look before you scope a pilot, because it tells you what one station costs to instrument.
If you want to talk through which of your stations to start with, bring the yield report.
Table of Contents